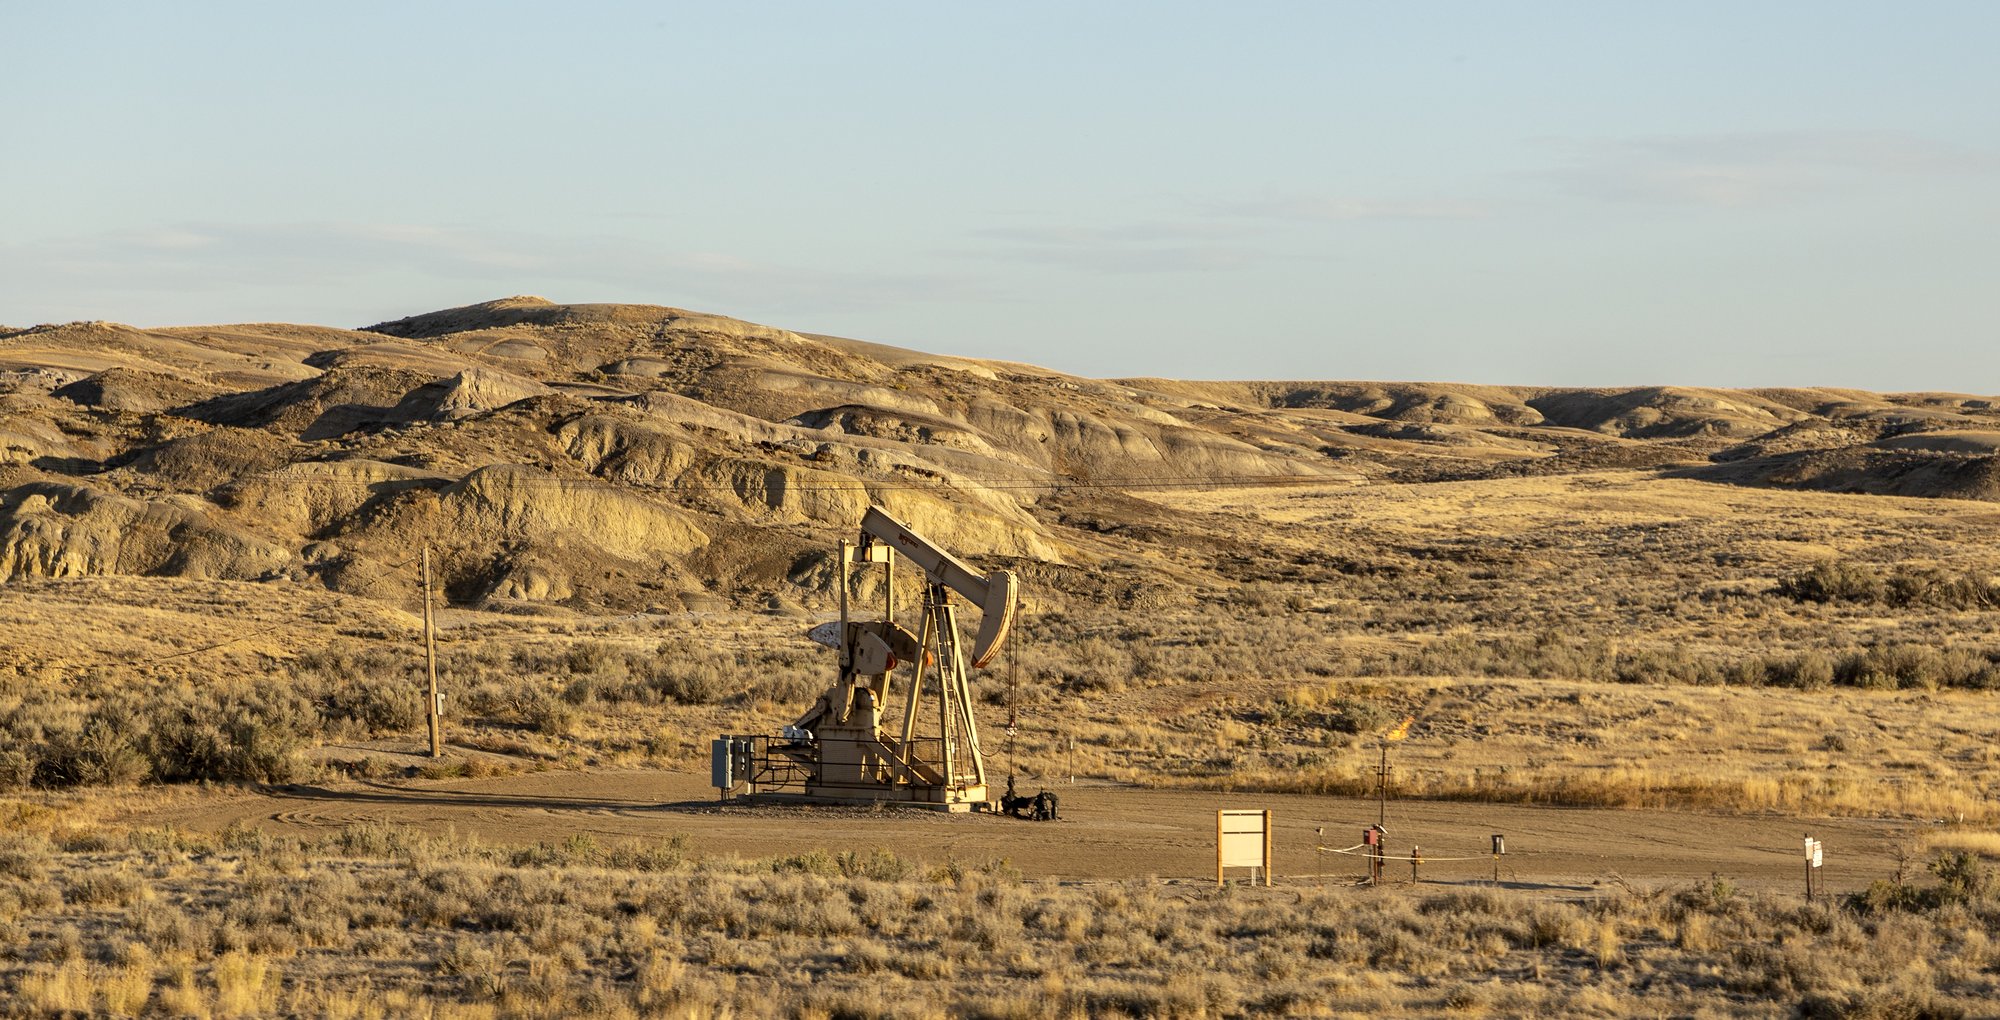
Oil daily trading in WTI is not a Hormuz headline with no barrel attached. The price signals are the averages and the five-session range. The last published Cushing close is $101.91 a barrel on Wednesday 14 October 2026, above the 20-day average of $97.44 and the 50-day average of $92.59, and that close is the five-session high. The bull through 31 December is $159.75, the base is $106.75, and the bear is $81.60.
The signal consensus coverage is missing is that the EIA file still ends on 14 October. A later screen is not a close. FinanceFeeds reported on 20 October that WTI was at $100.20 beside a December Brent contract at $111.08. Neither figure is a Cushing row. On the last published day, Europe Brent spot was $126.55, a $24.64 premium to WTI.
Key facts
- Cushing, Oklahoma WTI spot was $101.91 a barrel on 14 October 2026, up $1.05, or 1.04 percent, from $100.86 on 13 October. Source: EIA daily Cushing series, release date 15 October 2026, next release 21 October 2026. The 15 and 16 October cells are blank.
- The 20-day average is $97.44 and the 50-day average is $92.59, from closes ending 14 October 2026. The close is $4.47 above the 20-day mean and $9.32 above the 50-day mean.
- Five sessions through 14 October: $98.26, $98.73, $98.73, $100.86, $101.91. High $101.91 on 14 October. Low $98.26 on 8 October. The close is the high, so it is not outside the range.
- House bull $159.75, base $106.75, bear $81.60, from the last 90 daily log-returns and N of 54 sessions through 31 December 2026. Bull is 56.76 percent above the spot. Bear is 19.93 percent below it.
- Commercial crude inventories excluding the SPR were 415.577 million barrels in the week ending 9 October, down from 424.134 million on 2 October. Rigzone, citing the 15 October EIA report, quoted an 8.6 million barrel draw to 415.6 million, three percent below the five-year average.
- Ending stocks including the SPR were 698,560 thousand barrels for the week ending 9 October, down 8,557 thousand from 707,117 thousand on 2 October. Source: EIA WCRSTUS1, release date 15 October 2026.
- Europe Brent spot was $126.55 on 14 October, a $24.64 premium to Cushing at $101.91. Source: EIA Europe Brent spot. The 21 October weekly report was not in the pages fetched here.
- The IEA Oil Market Report, published 14 October 2026, forecasts demand down 2.6 million barrels a day on average in 2026, and down 2.5 million in the fourth quarter.
What the daily tape is actually signaling
The obvious reading is that a war headline has already repriced Cushing through $110, because that is where Brent futures were discussed on Tuesday. The saved series does not say that. The last completed print is $101.91, above both averages, at the top of a five-session band only $3.65 wide. That is a momentum fact inside a narrow range. It is not proof that later headlines are already in this benchmark.
In the week of 12 October the two official spots diverged. Cushing rose from $98.73 on Monday to $100.86 on Tuesday to $101.91 on Wednesday, up $3.18. Europe Brent spot went from $129.95 to $125.78 to $126.55, down $3.40 from Monday. The premium narrowed from $31.22 to $24.92 to $24.64. One fear and one barrel would not move the two spots in opposite directions on the only overlapping days.
The FRED CSV for DCOILWTICO timed out. The chart is the EIA Cushing page, the series FRED carries under that code. It is not Brent and it is not USO. Nasdaq shows USO at $160.61 a share on 20 October, up from $153.56 on 14 October, or 4.59 percent, on volume of 7,573,789 shares. That is a share price, not a barrel, and it is not in the bull, the base, or the bear. Wednesday 21 October is not a row either. The page lists that date as the next release. This note does not invent it, and it does not invent the 10:30 a.m. Eastern stocks figure.
The price signals, computed in public
The 20-day average divides the last 20 closes by 20. From 17 September through 14 October they are 103.21, 101.44, 96.97, 96.41, 93.38, 95.88, 85.23, 99.37, 96.16, 97.18, 99.77, 97.89, 96.13, 96.24, 95.02, 98.26, 98.73, 98.73, 100.86 and 101.91. The sum is 1,948.77. The mean is 97.4385, or $97.44. The close is $4.47 above it, 4.59 percent.
The last 50 closes sum to 4,629.57. Divided by 50, the mean is 92.5914, or $92.59. The close is $9.32 above it, 10.06 percent. Both averages are simple, taken from this file only.
The five-session high is the max of 98.26, 98.73, 98.73, 100.86 and 101.91, which is 101.91. The low is 98.26. The close equals the high, so it is inside the inclusive range. A break needs a later print above $101.91 or below $98.26. None is in the file.
The scenarios use the last 90 log-returns, the natural log of each close over the prior close. Mu is 0.00085996. Sigma, the sample deviation dividing by 89, is 0.03656777. One session dominates: $85.23 on 25 September to $99.37 on 28 September is a log-return of 0.1535, about 16.59 percent. The day before fell from $95.88 to $85.23. That round trip stays in the window.
N is 54, not 50, because the file has no 20 October or 21 October close. Count weekdays from 15 October through 31 December 2026, skip Thanksgiving on 26 November and Christmas on 25 December, and keep the early closes. October is 12 sessions: 15, 16, 19, 20, 21, 22, 23, 26, 27, 28, 29 and 30. November is 20, with 27 November counted. December is 22, with 24 December counted. 12 plus 20 plus 22 is 54.
Base is 101.91 times exp(54 times mu), which rounds to $106.75, $4.84 or 4.75 percent above the spot. Bull is 101.91 times exp(54 times mu plus 1.5 times sigma times the square root of 54), which rounds to $159.75. Bear is 101.91 times exp(54 times mu minus sigma times the square root of 54), which rounds to $81.60. Drift is positive, so no no-drift patch is required. The pair is not within $1 of a WTI bull and bear already together in an English FinanceFeeds title checked here. An August note used $120 and $60. This month’s Brent notes are another benchmark. The horizon stays 54 sessions.
Who is exposed
Cushing tankage is the first book. A CHItrader post on 15 October listed the week-ending 9 October crude draw at 8.557 million barrels, matching the including-SPR change saved here, and listed Cushing stocks up 1.862 million barrels. A national draw and a hub build can both be true. The hub figure was not recomputed from a separate EIA page, so it stays on that post.
Refiners are next. The EIA highlights PDF shows four weeks ending 9 October with crude inputs of 16,541 thousand barrels a day and utilization of 93.2 percent, versus 16,719 thousand and 94.0 percent in the four weeks ending 2 October.
The IEA on 14 October put October refinery runs at a seasonal low of 81.3 million barrels a day, rebounding to 84.6 million by year-end, with U.S. margins at new highs on discounted feedstock while Europe and Asia were crushed by freight and crude costs. September supply rose 2.5 million barrels a day to 102.3 million, driven by Gulf producers, and OPEC+ added 2.1 million led by Saudi Arabia.
USO holders marked the share-price gain above. Diesel buyers did not get a new close from a cargo. FinanceFeeds put President Trump’s 300,000 tons at about 2.25 million barrels, Tim Armitage of Quilter Cheviot’s figure, or 0.60 of a day against the 3.769 million barrel a day distillate rate cited there.
What was said, and what was not
OPEC’s secretariat posted volume, not a price, on 14 October: “In September, crude oil production by countries participating in the DoC increased by 0.90 mb/d, m-o-m, to average about 39.07 mb/d, according to available secondary sources.” The same post cycle described Dr. Abderrezak Benyoucef, head of energy studies, projecting African oil demand of 9.2 million barrels a day by 2050, 30 percent of the mix. That is a 2050 line. It does not mention $101.91.
The IEA account said the monthly report was out on 14 October, and on 20 October that “the conflict in the Middle East has triggered major disruptions in global oil and gas markets.” The 2.6 million barrel demand cut is on the report page. Neither the IEA text nor the EIA table fills 15 October through 20 October. That blank is the unpublished part of the tape.
Slobodan Banjevic, founder and director of HTG Hedge Funds, wrote on 18 October: “On October 16, WTI crude oil futures surged above $100 per barrel, gaining more than 11% over the week as escalating security risks in the Persian Gulf collided with tightening physical supply, falling US inventories and growing pressure on global fuel logistics.” That is a futures sentence for 16 October. It is not the EIA spot and not the formula price.
Warren Patterson and Ewa Manthey of ING wrote, as carried by FinanceFeeds: “Oil prices remain well-supported amid ongoing tensions in the Middle East despite relatively strong Persian Gulf flows,” and “Clearly, there are no signs of this yet.” That article, via Reuters and Oilprice.com on Kpler, put Gulf flows at 8.5 million barrels a day against more than 20 million two weeks earlier. Kpler itself was not fetched here.
Yahya Saree, spokesman for Yemen’s armed forces, denied a Saudi attack on 21 October. Middle East Observer, at 09:50 UTC, quoted him calling the Medina drone claim “a false claim and a great slander.” FinanceFeeds reported that army spokesperson Mohammad Akraminia said Hormuz would reopen if U.S. forces withdrew, and that Foreign Minister Abbas Araghchi’s seven-day proposal was still on the table, via Reuters. Central Command had redirected 138 commercial vessels, that report said. None of this fills an EIA cell.
As reported by marketsday on 20 October, Peter Schiff warned crude could climb toward $150 after SPR releases end following the midterms. That is not the house bull. The bull is $159.75 because September sits inside sigma.
Supply, stocks, and the regulator
The report in hand is the 15 October release for the week ending 9 October. Rigzone quotes EIA: “Commercial crude oil inventories (excluding the Strategic Petroleum Reserve) decreased 8.6 million barrels to 415.6 million barrels, three percent below the five-year average.” It also lists 415.577 million and 424.134 million, an SPR of 283.0 million on both weeks, gasoline up 3.5 million, distillate down 2.5 million and 12 percent under the five-year average, and total commercial petroleum down 13.4 million barrels. The SPR was down 30.6 percent from 10 October 2025.
415.577 plus 283.0 is 698.577 million. The including-SPR series reads 698.560 million. The 17 thousand barrel gap stays. CHItrader’s 8.557 million matches the including-SPR change. Rigzone’s 8.6 million is that move, called commercial there. The series are cited separately because the levels do not tie out to the barrel.
IEA supply falls 5.8 million barrels a day on average this year, to 100.7 million, then rises 7.7 million in 2027. Renewed Gulf attacks “leave the recovery fragile.” A demand cut and a steeper supply drop can share a page. Cushing does not choose between them until the next print.
FinanceFeeds reported on 13 October, from Bloomberg, that an adviser to CFTC Chairman Michael Selig told staff to withdraw an insider-trading referral on oil futures ahead of the 23 March Iran post. No public CFTC statement and no public charge were found. The diesel piece reported OFAC General License 135 for Russian-origin diesel, and the White House line that prices “will be COMING DOWN, IN RECORD NUMBERS, AND FAST.” Brooke Rollins said the $8 billion farm payments “will help bring certainty to our farmers during this harvest so they can continue to feed our nation.” A license and a payment are not settlements.
Bull, base, and bear
The cases are the formula on this Cushing file, not a bank target, not the reported $150, and not the August pair of $120 and $60. Versus $101.91:
| Case | Price | Versus the 14 October spot | What has to be true |
|---|---|---|---|
| Bull | $159.75 | +$57.84, or +56.76 percent | The September shock stays in the 90-day window for all 54 sessions, and later unpublished days do not flip the drift. This is 1.5 standard deviations over the drift, not the center of the path. |
| Base | $106.75 | +$4.84, or +4.75 percent | Only mu compounds. The IEA demand cut of 2.6 million barrels a day in 2026 can cancel that drift without changing the formula. |
| Bear | $81.60 | -$20.31, or -19.93 percent | One standard deviation under the drift. Price gives back the late-September rebound and finishes $3.63 under the $85.23 print of 25 September. |
The bear sits near prices already in the file, including $85.23 on 25 September and the low $70s last summer. The bull does not. The high since March on this chart is $114.58.
What happens next
Thursday 22 October is the next full session. The level is a published Cushing print above $101.91 or below $98.26. Above the high, the close leaves the saved range. Below the low, the “close at the high” reading ends. Between them, including a figure near Tuesday’s $100.20, the old band still holds and the benchmark is under the 14 October close. The 20-day average at $97.44 is the shelf under $98.26.
Today’s Weekly Petroleum Status Report, if it keeps 10:30 a.m. Eastern, was not on a page fetched here. The stocks file still shows release 15 October, next release 21 October, and a last week of 9 October. Until then the verified stocks are 415.577 million barrels excluding the SPR and 698,560 thousand including it. A build points toward the bear. A further draw supports a hold above $97.44. The barrel change is not guessed here.
By 31 December 2026 the drift-only base is $106.75. The bull at $159.75 is the upper band, not an order for September to repeat. The bear at $81.60 is the lower band. What moves the file is a published spot, then a stocks week, then the effect of the missing sessions on mu and on the five-session high. A denial, a futures screen, and a USO share price are not that row.
Frequently asked questions
Oil daily trading price signals at $101.91, bull $159.75, bear $81.60: is the Cushing close the signal?
Yes. The signal is the last published Cushing close, and a geopolitical headline is not a signal until it is a daily print. That close is $101.91 on 14 October 2026, above both averages and equal to the five-session high. The bull and the bear are the house band around that print, not a target copied from a headline. Later screens, including a Tuesday WTI figure of $100.20, stay outside the formula.
Where does the cited close sit against the averages and the five-session range?
It sits above both averages and at the top of the five-session range. The 20-day mean is $97.44, so $101.91 is $4.47 above it. The 50-day mean is $92.59, so the close is $9.32 above it. The five sessions span $98.26 to $101.91. Because the close is the high, it is inside the inclusive range. It is not a breakout past that band.
Why is the bull so far above $101.91?
Because one session inside the last 90 log-returns is large, and the formula keeps it. From $85.23 on 25 September to $99.37 on 28 September the spot rose about 16.59 percent. Sigma is 0.03656777. Scaled by the square root of 54 sessions and by 1.5, that width plus a small positive drift produces $159.75. The base, drift only, is $106.75. The bull is the shock case, not the center.
What crude stocks figure is actually published?
The week ending 9 October 2026, from the report released 15 October. Commercial stocks excluding the SPR were 415.577 million barrels. The EIA line quoted by Rigzone puts the draw at 8.6 million barrels to 415.6 million, three percent below the five-year average. The including-SPR series reads 698,560 thousand barrels, down 8,557 thousand on the week. Today’s report was not in the pages fetched here.
Is a Brent print near $110 the same tape as this WTI close?
No. On 14 October the EIA Europe Brent spot was $126.55, not $110, and Cushing WTI was $101.91. The $24.64 premium is the spread between those two official spots. A December Brent contract at $111.08, as FinanceFeeds reported on 20 October, is a later futures price. It does not fill the missing Cushing rows, and it is not the series in the chart.
What level matters on the next session?
The five-session high at $101.91 and the five-session low at $98.26. Thursday 22 October is the next full session after an unfinished Wednesday. A published Cushing print outside that band changes the range. A print between the two leaves the old band intact. Under the low, the 20-day average at $97.44 is the shelf between a dip and a loss of the average.
This is not financial advice.